Sunday, July 10, 2016

Lab 3 (GIS I)

Lab 3
By: Melissa Hackenmueller 

The goal of this lab was to find suitable habitat for the bears in Marquette County, Michigan using geoprocessing tool and vector analysis. The GPS location of bears within Marquette County was taken and then the data was analyzed. The most common habitat and streams were used to determine the best place to be set aside for bear habitat. 

To start off the top three most common habitats for the bears were found. Thirty bears were found in habitat classified as mixed forest land. Another sixteen were found in forested wetlands and the third most common habitat is evergreen forest land. Thirteen bears were located in evergreen forest land. Biologists know that bears may stay by streams for fish and water; therefore, bears within 500 meters of a stream were found. Joining, buffering, and overlay tools were used next to determine where the habitats and streams matched up. 


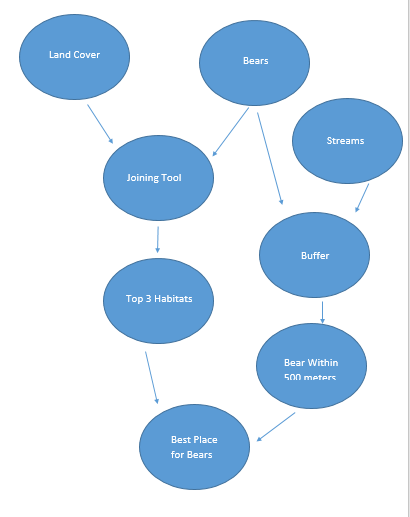
The results are that their are only a few places that meet this criteria of away from populous places but streams and mixed forests are needed. The map below show the results. 


Sources: State of Michigan Open GIS data. The link is http://gis.michigan.opendata.arcgis.com/ 

Saturday, July 9, 2016

The Best Place to Live (GIS I)

The Best Place to Live in Marion County, Oregon

By: Melissa Hackenmueller 

Moving can be a tough and stressful time and deciding where the perfect place to move to can be even trickier. This poses the question: Where would be the best place to live in Marion County Oregon. The different features needed for this destination city is it needs to have a population larger than 5,000 people but less than 30,000 people. It need to be within 20 miles of a hospital and it needs to be within 10 miles of a park that is at least five square miles large. This criteria would be good for a family that likes more of the small town feel but needs some larger stores near them. It would be ideal for a family with children that might need a hospital in case of emergency or anyone with health issues that needs regular appointments. The last feature of parks, is for an individual or family who enjoys hiking and the outdoors. This is a good start for a family looking to move to Marion County, Oregon.

The most important piece of data that was used to answer the question was the population data. The population of the city that one may choose to live in is very important piece of information. People like different sizes of cities so the cities feature is very important. The other two main features needed to answer this question are hospitals and parks. These two features fit the interests of the person looking to move to a certain area, so they may vary from person to person. The data for these features is from MGIS data folder. The largest concern with this data is that the latest population count is from 2007. That is almost a decade old; this older data might skew the perspective of the cities that are looked at.

The search for the best city in Marion County, Oregon to live in started with population. The select by attributes tool was used to find cities with more than 5,000 residences but less than 30,000. This narrowed down the choice to only three cities. The next criteria was at least 20 miles from a hospital. Next, the measuring tool was used to find the approximate distances from each city to the nearest hospital. The measuring tool was also used to find the distance from the three cities to the nearest parks. The identify tool was then used to find the square milege of the parks of interest. This process is shown in the flow model below.


From this data and analysis, it was found that Silverton would be the best place in Marion County, Oregon to live. The first step of finding population found out that in 2007 Woodburn had a population of 23,952, Slayton had a population of 7,732, and Silverton had a population of 8,450. The next step of measuring the distance from a hospital found that all three cities were closer than 20 miles to a hospital. Silverton was the closest, only 10.77 miles away from the nearest hospital. Slayton was the next only 13.16 miles away and Woodburn was the farthest but was only 15.61 miles away from a hospital. Finally, the distance from parks and the area of parks was looked at. Silverton was only 0.60 miles away from Silver Falls State Park, which is 35.10 square miles. Woodburn was only 0.28 miles away from Settlemier Park, but this park is only 0.03 square miles. The next closest park to Woodburn is Willamette Mission State Park which is 7.73 square miles but 8.25 miles away from the city. Slayton's closest park was also Silver Falls State Park, but Slayton was 4.58 miles from the park. These three cities are all good candidates, but Silverton was the closest to both a hospital and a park; therefore, it became the best place to live in Merion County. 


The overall impression of this project was that ArcMap and geospatial analysis can be used for a variety of things. From helping those in need after a massive earthquake to looking for a good place to live. This project made the many uses very evident. Next time this project is done, the use of most data would be an improvement. Things like schools could be added, if it was a family with young children looking to move or maybe a job would need to be accounted for. More data would improve this project. The largest problem that was faced during this project was the to come up with criteria for this ideal place to live and then to find the data to match up with the criteria. There was some challenges during this project but overall it taught the wide variety of things that GIS can be used for. 

Wednesday, June 29, 2016

Lab 2 (GIS I)

LAB 2
By: Melissa Hackenmueller 

The main objective of this lab was to learn how to utilized data from the U.S. Census Bureau to form maps on ArcGIS. Some other objectives were to learn how to download a shape file form the U.S. Census Bureau and learn how to join features classes. One of the newest obtained skills that was used for this lab was to choose a data set of choice of use it to build a map. Finally, both maps had to be organized and managed so they would be cartographically pleasing. Things like scales, legends, and titles also had to to added. 

The skills needed for this lab were a collection of things learned from the beginning of the course. The newest skill that needed to be achieved was how to search through the Census website to find data that was useful and that was wanted. Another main skill that needed to be obtained was how to download, save, and then upload these files into ArcMap properly. The data needed to be in the right format in order for it to be transferred correctly. The skill of joining the same feature class from two different data sets was also used. This helped the data to be more accessible but needed to be done correctly. Another skill was how to use the symbology tab to to create quantitative data maps that represented the data well. One of the last and most important skills needed in this lab was the skills to make the maps cartographically pleasing. This means to make them easy to read and pleasing to the eye. A few things were done to achieve this. The page layout was switched to landscape in order to make the maps larger and easier to see and the legends had to have proper titles in order for every reader to understand them. All of these skills together made the maps a success. 

The results of my maps were very similar. The population distribution map showed where most of the population was concentrated within the state of Wisconsin. The most concentrated part of the state was the south eastern counties. There is also various populated counties scattered relatively evenly throughout the state. The second map was a map of the percentage of males in the population. This was very similar to the first map, which makes logical sense. The most interesting part of the results was to stop and try to learn why the populous areas were so populous. For example, the far northwestern county has a relatively high population. This is because it is so close to the Minnesota city of Duluth. The questions that the results of this map brought up are a good thing to think about as you observe the map below. 


Source: U.S. Census Bureau 
Data Year: 2010


Wednesday, June 22, 2016

LAB 1 (GIS I)

LAB 1
By: Melissa Hackenmueller 

I am an Intern for Clear Vision Eau Claire and I used spatial data from City of Eau Claire and Eau Claire County 2013. I recently prepared a basic report of all important information dealing with the Confluence Project. I used ArcMap to do this. The goal of this was to use spatial data to become familiar with GIS within public land management, administration, and land use. Then, use these skills to prepare base maps for the Confluence Project in Eau Claire, Wisconsin. Hopefully, this will help Clear Vision continue the development of the Confluence Project without worry.

During this lab I have learned how to layer and stack various features.I have learned how to adjust a map to make it look most desirable, as well as, easy to read. I used the symbols tab in properties to show population per square mile. I have found have to rearrange the different data frames and how to work efficiently on six maps. I have learned the basics of what makes up a map. Maps normally need a legend, scale bar, north arrow, and title. These help readers understand the map more clearly. I have learned how to use base layers and the advantages of using them, such as, making geographic location more apparent to readers. Most importantly I have learned more tips and tricks about using ArcMap.

My results were that the various aspects of the Confluence Project line up equally. It doesn't conflict with any important boundaries. It is in voting district 31 and in a more densely populated part of the city of Eau Claire. Also, the University of Wisconsin- Eau Claire has bought two lots for the Confluence Project. They are on Eau Claire Street and on Graham Avenue. Most importantly my results show that the Confluence Project is in a good location. This can be seen more clearly using the maps that I have created below.

The sources that I used to create this data are the City of Eau Claire and Eau Claire County 2013.