Lab 2: Watershed Analysis
Melissa Hackenmueller
Goal
The watershed analysis lab had two main goals. The first was to use ArcGIS to understand and master the skills needed to delineate watersheds of a specified region. The second goal was explore ModelBuilder and gain knowledge on the structure of workflows and its uses.
Methodology
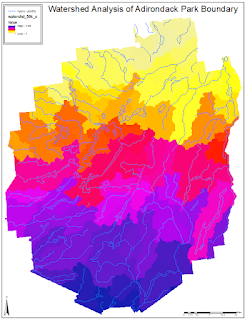
Part 1 was the delineation of watersheds. A watershed is an area of land that all surface water drains through a specific point (stream or lake) in that basin. All water within the watershed is connect; therefore, contamination in the upstream portion of a watershed will affect all of the downstream water. Therefore, the studying and understanding of watersheds is very important for environmental restoration and protection. This lab will delineate the watersheds of Adirondack Park in northeastern New York. The data for this lab was collected from the New York State GIS Clearinghouse and Cornell University's Geospatial Information Repository site. The first step of this project was to create a geodatabase and save both files in this newly formed geodatabase. The next step is processing the data. The projections for each of these files is different, so I used the data management tools to make sure the data was in a uniform projection coordinate system, which in this case was UTM Zone 18N NAD 1983 meters. Next, I created a 20 km buffer around the park boundary to create smoother watersheds later. The clipping tool was used next to create a shapefile of just streams with Adirondack Park. A 30 arc-second DEM of North America was then added and converted to the correct coordinate system. I then clipped the DEM as well to fit the size of the buffered park boundary. The next step was to resample the data to a 60 m pixel size by using Project Raster in the Data Management tools. Now, the flow direction needs to be calculated using the flow direction tool from the Spatial Analysis Toolbox. I then found that sinks appeared in this data, which needed to be removed. I used the fill tool to do so, then did the process of flow direction again using the new filled file. Next, I used the flow accumulation tool to determine where flow accumulates. The Conditional tool was then used with a value of >50,000 to show faint stream channels. I then created a source raster that showed unique stream links. Finally, the data was ready to use the watershed feature. Using the flow direction raster and the source raster as input, a watershed raster was created. Figure 1 shows the watershed delineation and the streams of Adirondack Park, New York.
Part 2 was using ModelBuilder to find areas in Denmark at risk of flooding in a Cloudburst. Cloudbursts are sudden, extreme rainfall events that occur in a very short amount of time and overwhelm infrastructure and create major flooding. Using ModelBuilder a model can be built to find depressions in a specified region and building that overlap with those depressions; therefore, find the buildings at risk. A model was already created as an ESRI lesson and this is what I used to expand my knowledge of ModelBuilder and its uses. The first step was to locate the first model in the geodatabase and assess all of its properties. Then I validated and ran the model. This model then created new shapefiles of Bluespots (depressions in the landscape that are susceptible to flooding) and of Buildings touching bluespots. I added these new shapefiles to ArcMap and corrected the symbology and created Figure 2. Another model was then used to create a more in-depth map that included the volume and the watershed of the bluespots, as well as, the amount of rainfall needed to fill each bluespot. I ran this model and then corrected the symobology again to create Figure 3. Next, I added the watershed layer with discrete color symbology to correlate the bluespots and watersheds (Figure 4).
Results
 |
| Figure 1 |
 |
| Figure 2 |
 |
| Figure 3 |
 |
| Figure 4 |
References
New York State GIS Clearinghouse. Adirondack Park Boundary Shapefile. http://gis.ny.gov/.
Cornell University Geospatial Information Repository. Hydrology Features of New York State. NatlAtlas. http://cugir.mannlib.cornell.edu/index.jsp.
ERSI. Find Areas at Risk of Flooding in a cloudburst. https://learn.arcgis.com.
No comments:
Post a Comment